Strategizing EHS Data to Prevent Accidents in the Workplace
Author: Tony Mudd, CSP Published: 6/13/2023 Time: 3 Minutes

The world of data has taken us by storm with Al technologies that can predict patterns in human behaviors to robots that are built to preserve human life. Data is what drives safety performance in the workplace especially when it comes to audit records, tracking injuries, closed incident investigations as well as the number of hazards reported in the workplace.
Today’s technology is rapidly changing the way companies approach workplace safety. After a decade of working as a Safety Professional and using data to prevent accidents in the workplace, one thing that I have learned is that data changes everything. Tech advancements in the world of data analytics have changed the way many businesses engage and lead their teams. Some have earned significant returns after applying the proper EHS data strategies to drive workplace safety.
Even though technology is getting better each year, many companies have failed to develop effective EHS data strategies that provide real-time information on how to drive down injuries and possible environmental exposures. Many companies are currently operating at or near the lower end of the data spectrum by collecting a limited number of the same EHS data points that they have collected for decades and calculating the same EHS lagging indicators which give them minimal information on what really going on in the workplace.
Most times the information provided the information does not answer why accidents continue to happen or if the countermeasures are really working. Their data is based on speculation and assumption, not the facts. The team should not just be interested in a low incident rate but the specific steps they took to drive down the number of accidents in their workplace.
To develop an effective EHS data strategy the company will need to incorporate several data techniques:
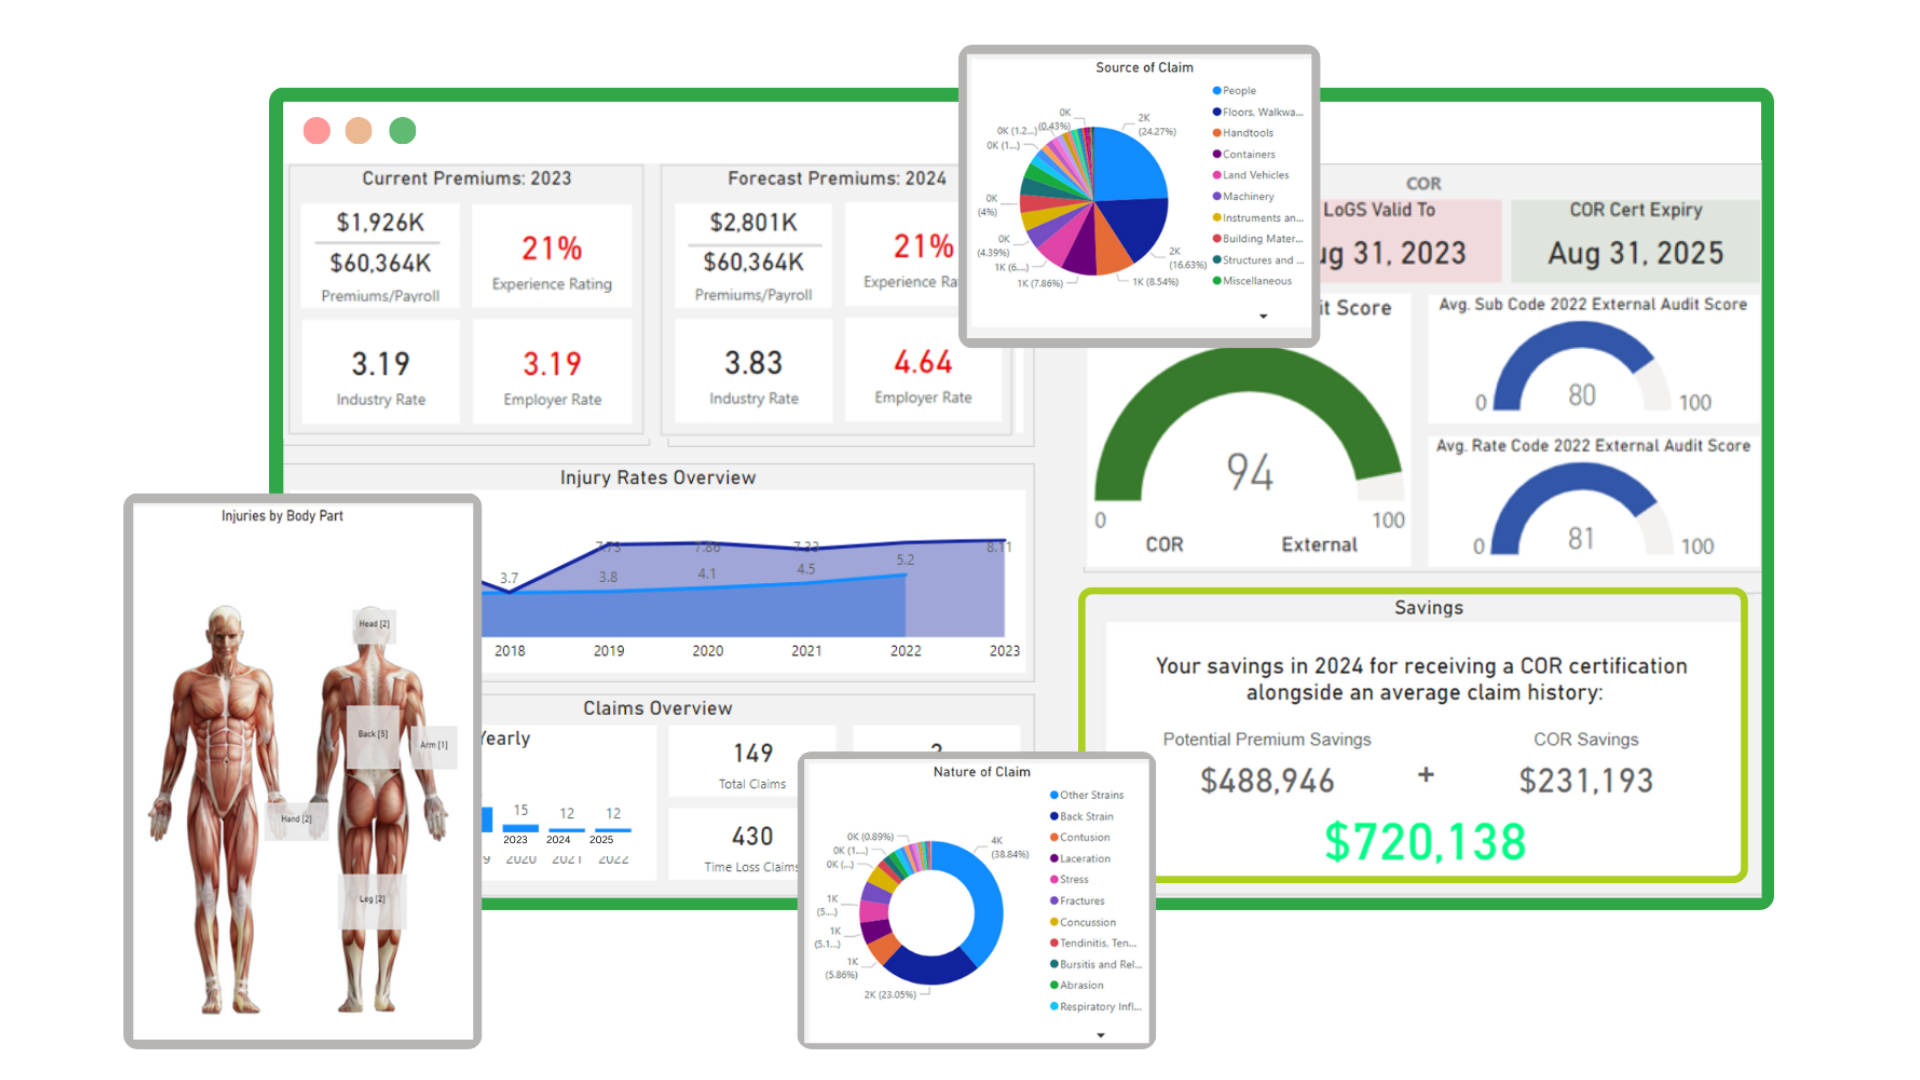
1) Select data visualization tools to be used for EHS analytics. There are several of these types of tools on the market such as Power Bi or Tableau that can be used to help your team see what their data looks like in a chart or graph. It is imperative that the team is properly trained in how to use the basic functions of the system to ensure that they are getting the most out of their data. Think of it this way the team will only use the data if they can understand how to get to it.
Another reason to use data visualization tools is that many companies still use whiteboards and white sheets of paper to present data which in turn offers a poor environment to ask questions, drill down, and track data in real-time. It does not allow for the team to get to the root of the problem. Once the data is eased or the sheet of paper is thrown away no one ever thinks about the EHS data again. Trust me, I would urge teams to break that habit and use large computer monitors in their meeting areas to present information.
2) Find the right EHS KPIs for the team. Selecting the proper EHS KPIs and metrics that are critical. Each company’s KPIs may be different as many companies have different EHS goals. It’s always a good idea to survey management and leadership to see what the top 3 KPIs are that would be beneficial to them when making decisions around safety and environmental projects. Knowing what your stakeholders want is a good start, but I would challenge them to also establish new or different EHS data points every quarter to see if you can get new answers to your problems.
Also, when formulating your EHS data strategy, think about what metrics are currently working for your organization. What KPIs will other teams need? How will you collect the data needed for the KPI? (i.e., PPE vending machines, EHS Management Systems, Manual Entry, Wearable Technology, Body Detection cameras, etc.) What goals exist within your organization that you may need to align with?
3) Keep your EHS data creative and interesting. Looking at EHS data can be a tedious task for any team member. That’s why it’s important to make sure the data is clean, clear, and consistent. It should be easy on the eyes and modern. Think of it this way your EHS data dashboards should be something people want to share. It needs to help create dialogue within the team. It should cause them to ask why or how we can do better. Some interesting sample EHS indicators to use could be:
- Top 3 forklifts involved in workplace accidents.
- Top 2 gloves worn during hand injuries.
- Top 2 boots worn during foot injuries.
- Top 3 work areas for most team members to slip or fall.
- Top 3 jobs most likely to get someone hurt.
- Average number of Stop Works in week/month.
- Total Workplace Stress levels of floor team members.
- Average amount of sleep employees get at night.
- Average number of team members who are fully hydrated.
- Average amount of time spent on safety topics per day.
- Average time for team members to complete safety quiz.
- Average test scores on completed safety quizzes the first time.
Your EHS KPIs should be getting more specific each year as you better understand your data and how to apply it in your business. One thing that I would recommend is to create one or two new EHS KPI data points per business quarter and allow the team to weigh in on how well the targets are providing information to move forward. This will help keep the EHS dashboard and scorecards fresh and allow leadership teams to have different information to discuss during meetings.
4) Share EHS data only with those who need it. One of the biggest frustrations with sharing EHS data is sending the wrong data to the wrong facility or department. This is why it is important to set security restrictions and follow your company’s rules on sharing data within our organization. I would recommend only sending EHS data to a specific department or location. It’s always inconvenient when you open a safety data report, and you can’t find what you need because you must decipher through every other facility's data.
EHS Data and analytics should be an integral part of leading a company’s EHS programs as it helps management understand why accidents are occurring. Using data analytics and predictive data analysis in your EHS program can decrease workplace accidents, reduce overhead costs that directly impact the company’s bottom line, improve employee morale, and strengthen the business's reputation. Ultimately incorporating data analytics is imperative to the life of your business.
It’s not just a good idea but it’s good business sense. It could determine the life or direction of your company. It’s a small investment for a tremendous cause. Your team’s safety can only get better if you are able to see the patterns of wrongs that happened in the past to correct the future. This can only be done by using data to combat accidents.
I hope you enjoyed this article, and that you can use some of the information to build a stronger EHS Data strategy. If you need a little help with your EHS Data Strategy were always here to help. Contact us today.
Stay Safe Today!
#SensoriSafety #OSHA #EHSDATA #safetytech #safetyblog #safetyfirst #workersafety #safetytips #safetyprofessionals #safetyprofessional #ehscommunity